---
title: "Using Pinpoint Cloud"
slug: "pinpointcloud-use"
tags: ["Pinpoint Cloud"]
updated: 2026-09-17T09:23:56Z
published: 2026-09-17T09:23:56Z
canonical: "guide.ncloud-docs.com/pinpointcloud-use"
---
> ## Documentation Index
> Fetch the complete documentation index at: https://guide.ncloud-docs.com/llms.txt
> Use this file to discover all available pages before exploring further.
# Using Pinpoint Cloud
Available in Classic and VPC
Describes how to use the Pinpoint Cloud web console and how to integrate applications using Pinpoint Agent. The Pinpoint Cloud web console lets you monitor the performance of your applications. The Pinpoint Cloud web console has the same UI as the open source version of Pinpoint, making it easy for existing Pinpoint users to adapt.
## Installing and Managing Agents
To use Pinpoint Cloud, you must install Pinpoint Agent on the application to be monitored. The Pinpoint Agent runs as a Java Agent connected to the application to be monitored (e.g. Tomcat). To connect Pinpoint Agent to a monitored application, you must forward `$AGENT_PATH/pinpoint-bootstrap-$VERSION.jar` to the `-javaagent` JVM argument when the application runs.
### Installing Agents
To install Pinpoint Agent, configure the appropriate environment variables and download the link to your PC. Follow these steps to install Pinpoint Agent:
1. In the NAVER Cloud Platform console, click **Menu** > **All Services** > **Management & Governance** > **Pinpoint Cloud** menu in order.
2. Click the **[Shortcut]** button for the desired repository from the list.
3. After logging in to the web console, click  in the top right corner and go to the **Installation** menu.
4. Configure the following environment variables for your Agent.
- **Application Name**: Enter the application group ID and click **[Check]**
- **Agent ID**: Enter the application ID and click **[Check]**
5. Once the JVM argument is configured with the information entered, click  to copy the code.
- Remember to add this code to your application's launch options later.
6. Click the **Download Link** to download the zipped file.
7. After unzipping the downloaded Agent file, finish configuring your launch option and license key settings for the application to be monitored.
```
CATALINA_OPTS="$CATALINA_OPTS -javaagent:$AGENT_PATH/pinpoint-bootstrap-$VERSION.jar"
CATALINA_OPTS="$CATALINA_OPTS -Dpinpoint.agentId=$AGENT_ID"
CATALINA_OPTS="$CATALINA_OPTS -Dpinpoint.applicationName=$APPLICATION_NAME"
```
- Configuring your launch option settings: Example: For Tomcat, modify the Tomcat startup script in the `$CATALINA_HOME/bin/catalina.sh` file as shown below, then save the file.
- Configuring your license key settings: Move your cursor over the **Agent License Key** and click  to copy the license key, then paste it into the `$AGENT_PATH/pinpoint.license` file and save it.
8. Run the application.
- Once installed, the Pinpoint Agent collects your application’s performance data.
### Adjusting Pinpoint log levels
To adjust the log level for each Pinpoint component, modify the `log4j.xml` file as shown below.
```
(omitted)
(omitted)
```
## Key Features
This is a quick guide to the main features of the Pinpoint Cloud web console.
Note
The Pinpoint Cloud web console has the same UI as the open source version of Pinpoint. Please refer to the [Pinpoint official website](https://pinpoint-apm.github.io/pinpoint/main.html) for more detailed instructions.
### Server Map
The Server Map displays the configuration of your distributed system. Click on a node to show the current status, transaction count, and other details for a component.
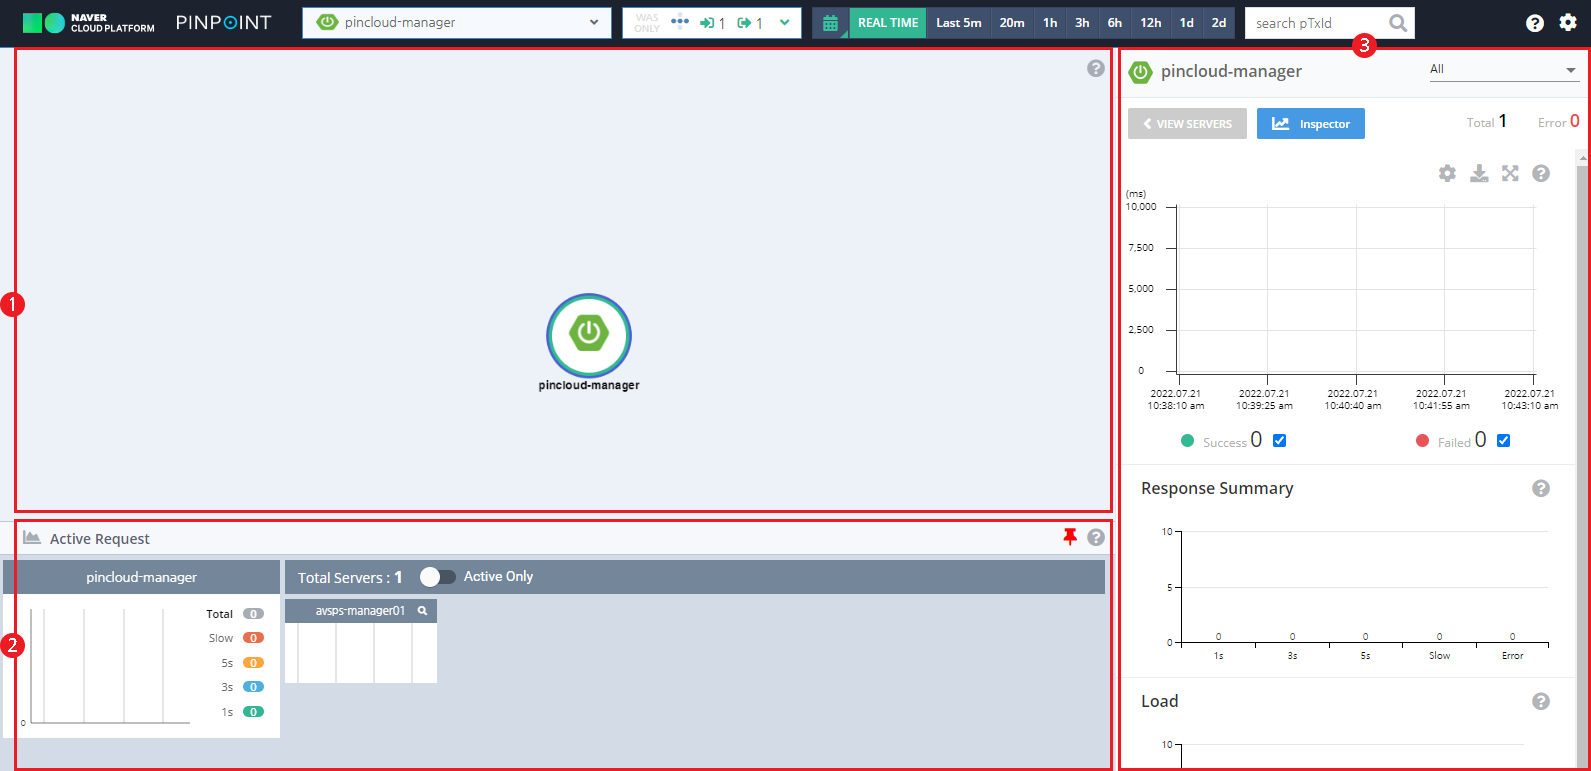
| Component | Description |
| --- | --- |
| ① Server Topology | The architecture of your application servers - Shows the number of transactions from user requests sent to each node - Select a node to show details as a chart |
| ② Active Request | Shows the number of active threads in the application you're monitoring in real time |
| ③ Charts | Show the details of a selected node using scatter and bar charts |
### Call Stack
The Call Stack lets you view system transactions at the code level to quickly identify bottlenecks and failure points and instantly check application errors and exceptions.
Select a transaction recorded in the Server Map’s scatter chart to display a Call Stack as shown below.
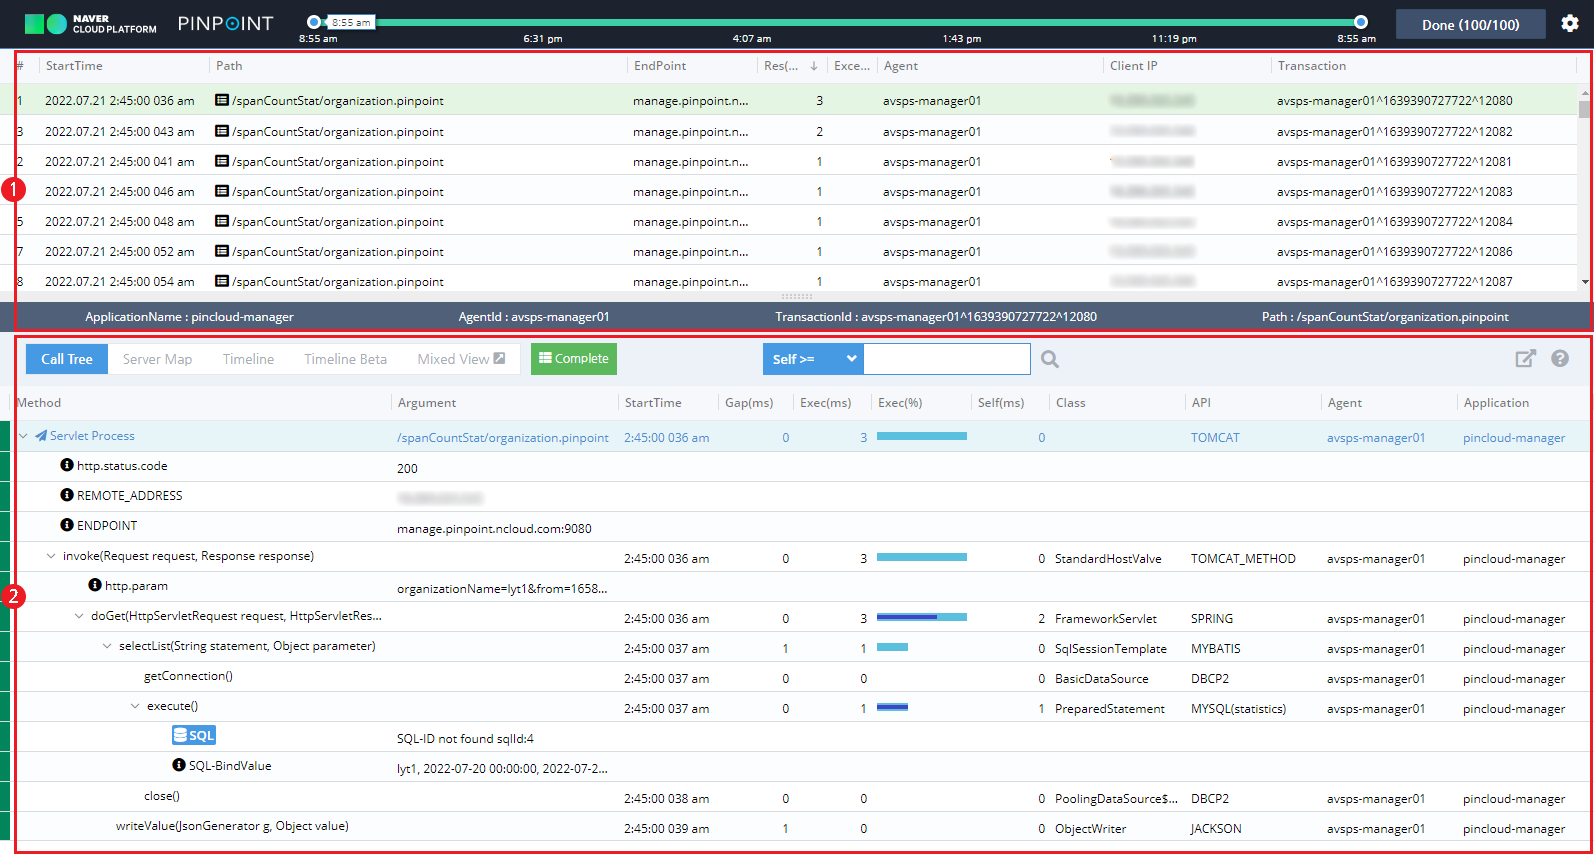
| Component | Description |
| --- | --- |
| ① Transaction List | List of selected transactions - Select an item to show its details in the **Call Tree** area |
| ② Call Tree | List of methods executed during the transaction |
### Application Inspector
The Application Inspector allows you to check your application's resource data (stat: CPU, Memory, TPS, datasource connection count).
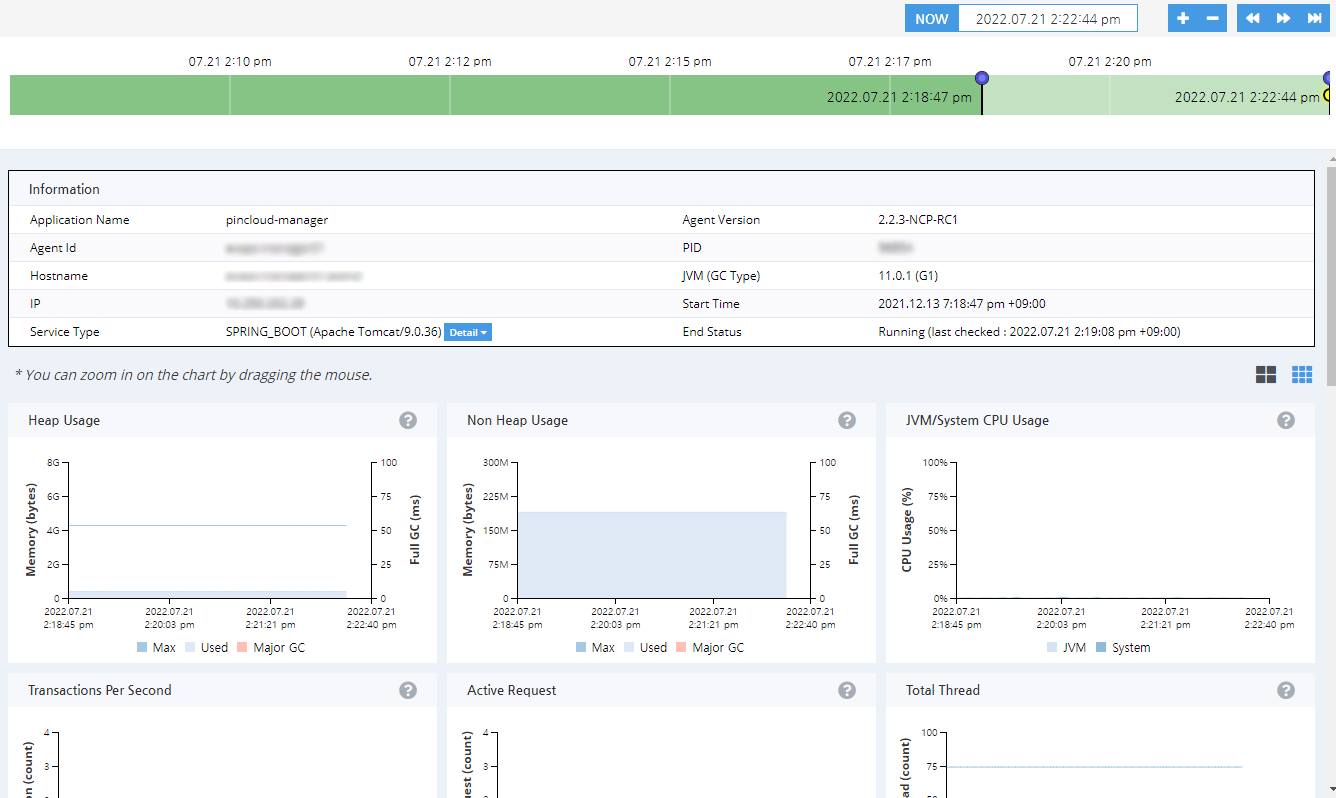
- Drag the cursor across a specific area on the chart to zoom in to the selected area.
- While zoomed in, you can click the **[Reset Zoom]** button to zoom back out.
## Settings Menu
You can access the settings menu by clicking  in the Pinpoint Cloud web console. The available settings menus are as follows.
Note
This guide covers the menus shown for an administrator account. Some menus may not be visible for certain accounts when you connect.
| Menu Name | Description |
| --- | --- |
| **Administration** | Manage Web Console User and Agent Data by Repository - **Users**: Add/edit/delete user accounts (See[Managing Users](/docs/en/pinpointcloud-use#%EC%82%AC%EC%9A%A9%EC%9E%90%EA%B4%80%EB%A6%AC)) - **Role**: Set user roles and permissions (See[Managing Roles](/docs/en/pinpointcloud-use#%EC%97%AD%ED%95%A0%EA%B4%80%EB%A6%AC)) - **Agent Statistic**: Get Agent statistics - **Agent Management**: View and delete applications registered with Agent |
| **Setting** | Repository-Specific Web Console Settings**General**: Server Map notation categories, time zones, time display formats, and language settings**Favorite List**: Favorite/unfavorite an application**User Profile**: Edit user information |
| **User Group** | Add and manage user groups (See[Managing User Groups](/docs/en/pinpointcloud-use#%EC%82%AC%EC%9A%A9%EC%9E%90%EA%B7%B8%EB%A3%B9%EA%B4%80%EB%A6%AC)) |
| **Authentication & Alarm** | Set application permissions and notifications by user group (See[Setting Application Permissions and Notifications](/docs/en/pinpointcloud-use#%EC%95%A0%ED%94%8C%EB%A6%AC%EC%BC%80%EC%9D%B4%EC%85%98%EC%82%AC%EC%9A%A9%EA%B6%8C%ED%95%9C%EB%B0%8F%EC%95%8C%EB%A6%BC%EC%84%A4%EC%A0%95)) |
| **Installation** | Set and download Agent installation environment variables (See [Agent Installation](/docs/en/pinpointcloud-use#Agent%EC%84%A4%EC%B9%98)) |
### Managing Users
Manage user accounts created for the repository web console.
#### Adding Users
To add a new user, follow the steps below.
1. In the Pinpoint Cloud web console, go to ** > Users**.
2. Click  at the top of the user list.
3. Enter user information, then click the **[Save]** button.
- User roles can be set in the **Role** menu. To create a new role, see [Creating Roles](/docs/en/pinpointcloud-use#%EC%97%AD%ED%95%A0%EC%83%9D%EC%84%B1).
Note
To edit information for an existing user, select a user from the list, enter the new information in the appropriate fields, and click **[Save]**.
#### Deleting Users
To delete a user, follow the steps below.
1. In the Pinpoint Cloud web console, go to ** > Users**.
2. From the list of users, click  for the user you want to delete.
3. Click the **[Delete]** button.
### Managing Roles
You can manage roles and permissions for users of the repository web console.
#### Creating Roles
To create a new role, follow the steps below.
1. In the Pinpoint Cloud web console, go to ** > Role**.
2. Click  at the top of the roles list.
3. Enter a name for the role, select permissions to grant, and click the **[Save]** button.
Note
To edit information for an existing role, select a role from the list, chose permissions, and click the **[Save]** button.
#### Deleting Roles
To delete a role, follow the steps below:
Note
When deleting a role, the permissions of the users assigned to that role are also deleted.
1. In the Pinpoint Cloud web console, go to ** > Role**.
2. From the list of roles, click the  of the role you want to delete.
3. Click the **[Delete]** button.
### Managing User Groups
You can group users together to specify which applications they can use and set multiple users as alarm recipients at once.
#### Viewing User Groups
You can view a list of user groups and the details for each group. To view a user group, follow the steps below.
1. In the Pinpoint Cloud web console, go to ** > User Group**.
2. Check your group information on the User Group interface.
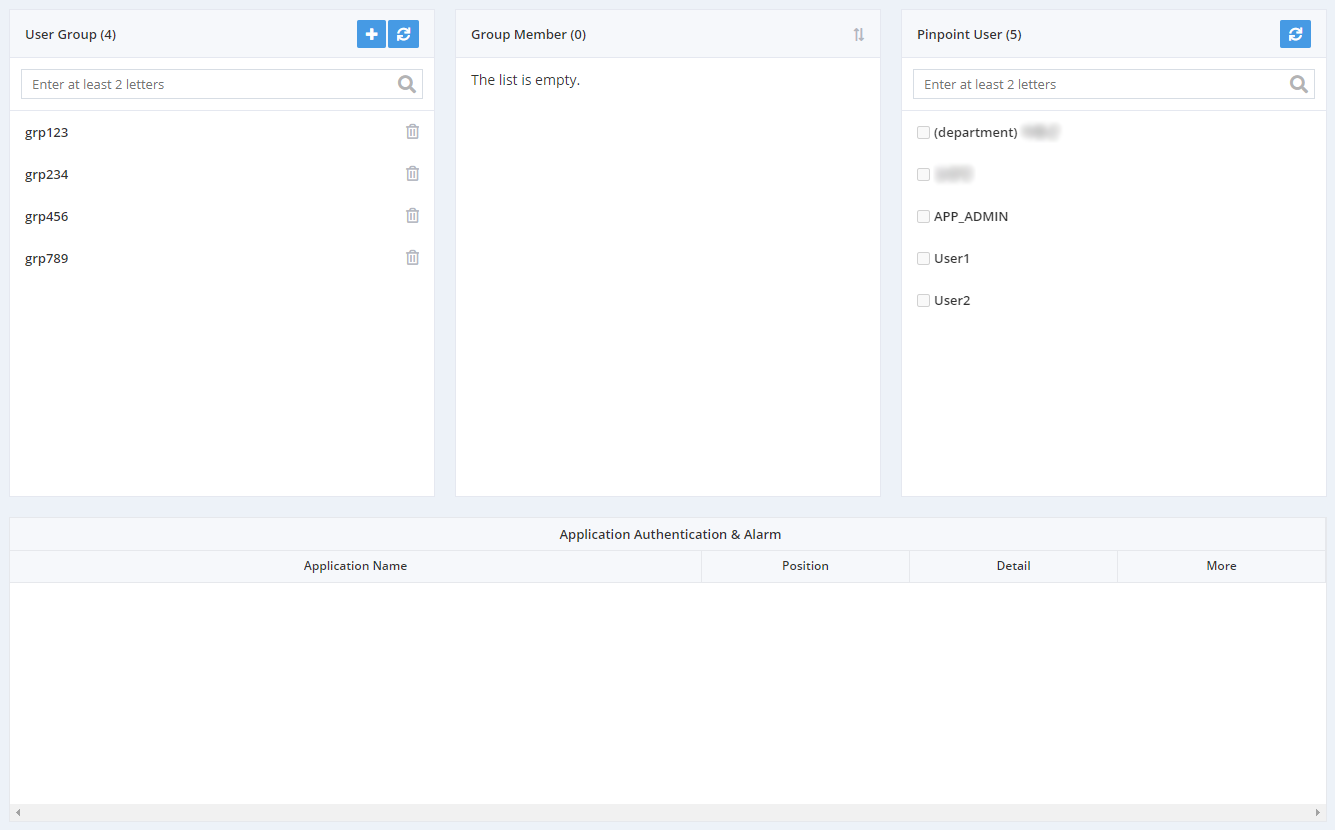
- **User Group**: List of User Groups
- Clicking an item in the list displays a list of members who belong to that group in **Group Member**.
- You can create a new user group by clicking .
- You can delete a user group by clicking .
- **Group Member**: A list of members in the selected group
-  You can remove a member from the group by clicking **>** .
- **Pinpoint User**: A list of all registered users for the Pinpoint Cloud web console
- While a group is selected, clicking the checkbox in front of a user's name to select them will add that user as a group member.
- Click on a username to see the profile details.
- **Application Authentication & Alarm**: A list of applications assigned to the selected group
- You can check application permissions by clicking  in the **Detail** field.
- You can navigate to the **Authentication & Alarm** menu by clicking  in the **More** field.
#### Creating User Groups
To create a new user group and add members, follow the steps below.
1. In the Pinpoint Cloud web console, go to ** > User Group**.
2. Click  at the top of the **User Group** list.
3. Enter a name for the user group, and then click the **[OK]** button.
4. Click the created user group, then select members to be added from the **Pinpoint User** list by clicking their checkboxes.
- Users selected this way are added to the **Group Member** list.
### Application Permissions and Notification Settings
You can grant permissions to user groups for applications registered in the Pinpoint Cloud web console and set up event notifications.
#### Set user permissions
To set permissions for your application and grant them to groups of users, follow the steps below.
1. In the Pinpoint Cloud web console, go to ** > Authentication & Alarm**.
2. In the **Application** list, click the application you want to grant permissions to.
3. Click  at the top of the **Authentication** list.
4. After selecting the user group IDs and positions to grant permissions to, configure data visibility and click the **[OK]** button.
- The permission configurations are now added to the list.
- Click  to see whether the data is visible to other parties.
- Click  to change positions and data visibility.
-  You can delete permission configurations by clicking **>** .
#### Notification Settings
You can set an alarm to send an SMS/email when a certain metric threshold is exceeded. The following metric items are available for alarm configuration.
| Item | Description |
| --- | --- |
| SLOW COUNT | Sends an alarm when the number of outside requests that called your application exceeds the threshold for late responses to external servers |
| SLOW RATE | Sends an alarm when the percentage of outside requests that called the application from the exceeds the threshold for late responses to external servers |
| ERROR COUNT | Sends an alarm when the number of outside requests that call the application and result in errors exceeds a certain threshold |
| ERROR RATE | Sends an alarm when the percentage of outside requests that call the application and results in errors exceeds a certain threshold |
| TOTAL COUNT | Sends an alarm when the number of outside requests calling your application from the exceeds a certain threshold |
| SLOW COUNT TO CALLEE | Send an alarm when the number of late responses from calls to external servers from your application exceeds a certain threshold. In the note field, enter the domain or address (IP, port) of the external server. Example: naver.com, 127.0.0.1:8080 |
| SLOW RATE TO CALLEE | Sends an alarm when the percentage of requests that called external servers from your application and gave a late response exceeds a certain threshold. In the note field, enter the domain or address (IP, port) of the external server. Example: naver.com, 127.0.0.1:8080 |
| ERROR COUNT TO CALLEE | Sends an alarm when the number of requests that call an external server from your application and result in an error exceeds a certain threshold. In the note field, enter the domain or address (IP, port) of the external server. Example: naver.com, 127.0.0.1:8080 |
| ERROR RATE TO CALLEE | Sends an alarm when the percentage of requests that call an external server from your application and result in an error exceeds a certain threshold. In the note field, enter the domain or address (IP, port) of the external server. Example: naver.com, 127.0.0.1:8080 |
| TOTAL COUNT TO CALLEE | Sends an alarm when the number of requests that called an external server from your application exceeds a certain threshold. In the note field, enter the domain or address (IP, port) of the external server. Example: naver.com, 127.0.0.1:8080 |
| HEAP USAGE RATE | Sends an alarm when HEAP utilization exceeds a certain threshold |
| JVM CPU USAGE RATE | Sends an alarm when an application's CPU utilization exceeds a certain threshold |
| SYSTEM CPU USAGE RATE | Sends an alarm when a server's CPU utilization exceeds a certain threshold |
| DATASOURCE CONNECTION USAGE RATE | Sends an alarm when connection utilization within an application datasource exceeds a certain threshold |
| DEADLOCK OCCURRENCE | Sends an alarm when deadlocks are detected in your application |
| FILE DESCRIPTOR COUNT | Sends an alarm when the number of open file descriptors exceeds a certain threshold |
To set up notifications to send to a group of users when an event occurs, follow the steps below.
1. In the Pinpoint Cloud web console, go to ** > Authentication & Alarm**.
2. Click  at the top of the **Alarm** list.
3. After configuring alarms and thresholds, select the user group ID to receive the alarm and the alarm format, then click **[OK]**.
- The alarm contents are now added to the list.
- You can change the contents of the alarm by clicking .
-  You can delete the contents of the alarm by clicking **>** .